Clip Web User Interface
The Clip Web interface can be accessed by pointing your Web browser to one of these URLs:
http://Clip Server:9090![]() ( for HTTP )
( for HTTP )
https://Clip Server:9443![]() ( for HTTPS)
( for HTTPS)
Provide the credentials in the Logon Window (default user and password is "admin"). After login, the Clip UI displays the dashboard as the initial page.
Dashboard Tab
The Clip Dashboard gives you an at-a-glance overview of the health of your integrations in graphical form. The data updates in real time so that you are always presented with the most recent information. It enables you to quickly assess the health of target connections and transactions, and to identify areas that require your attention.
The dashboard page is divided into three vertical display areas and one for the dashboard settings which define the content and the update cycle of the upper two:
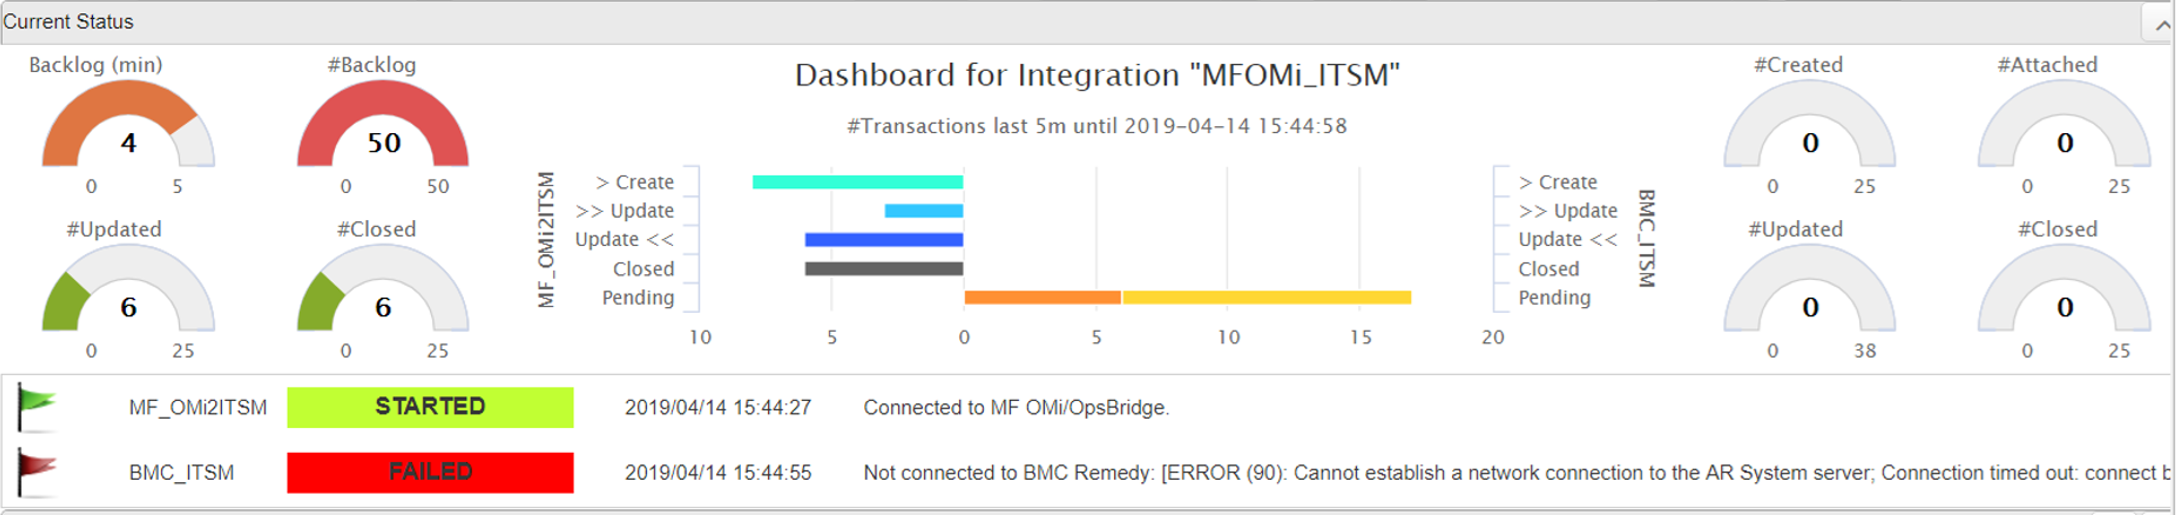
The top area, "Current Status", shows the connection status for the targets of the selected integration and the number of successful, failed and pending transactions performed by Clip during the last interval.
In the "Transaction History" area, each type of transaction is shown as a separate line in a line chart – the left two charts relate to the "source" whereas the right ones to the "destination" target The upper two line charts display data related to receipt and creation of new events and incidents whereas the lower two line charts show data for them when bi-directionally kept in sync, i.e. data for receipt of changed events and incidents and updates on the peer side. In addition to showing the number of transactions, for "manipulating" transactions ( creation & updates ) also the processing time is displayed with its minimum, maximum and average per interval.
In the bottom area, the "Synchronization Status" displays two pie charts: the "Status Summary" and the "Transaction Summary". These are not updated periodically but only by a page reload and display information for all configured targets and integrations.

In the dashboard settings area, there is
- A drop-down list to select the integration that is supposed to be shown in the upper two display areas of the dashboard
- the dashboard shows data until either
- "now" – the current time. Selection of "now" enables automatic update of the dashboard after an adjustable interval (default: one minute).
- – or - a date and time that is set manually in the datebox – this allows to analyze history data.
- the number of intervals specifies how many datapoints are shown per line in the charts of the "Transaction History" area and the
- duration defines which time interval each datapoint represents ( s: second, m: minute, h: hour, d: day, w: week ).
- "alignment" of intervals specifies whether the last interval ends at the exact time when the dashboard is updated or initially displayed, or an aligned date and time according to the duration: for instance, when alignment is activated and a one hour duration is selected, a refresh of the dashboard at 1:23pm would display the last interval end at 1:00pm, the last full hour.
The upper two areas, "Current Status" and "Transaction History" show data on the left side for the first target of an integration ( source target ) and data for the second target ( destination target ) on the right side. For each target, the number of incidents received, created, attached, updated and closed are displayed in a gauge and barchart view:

For integrations with MF OMi/OpsBridge as event source, two gauges additionally display the backlog – the number and age of events and changes waiting to be processed:

Incidents Tab
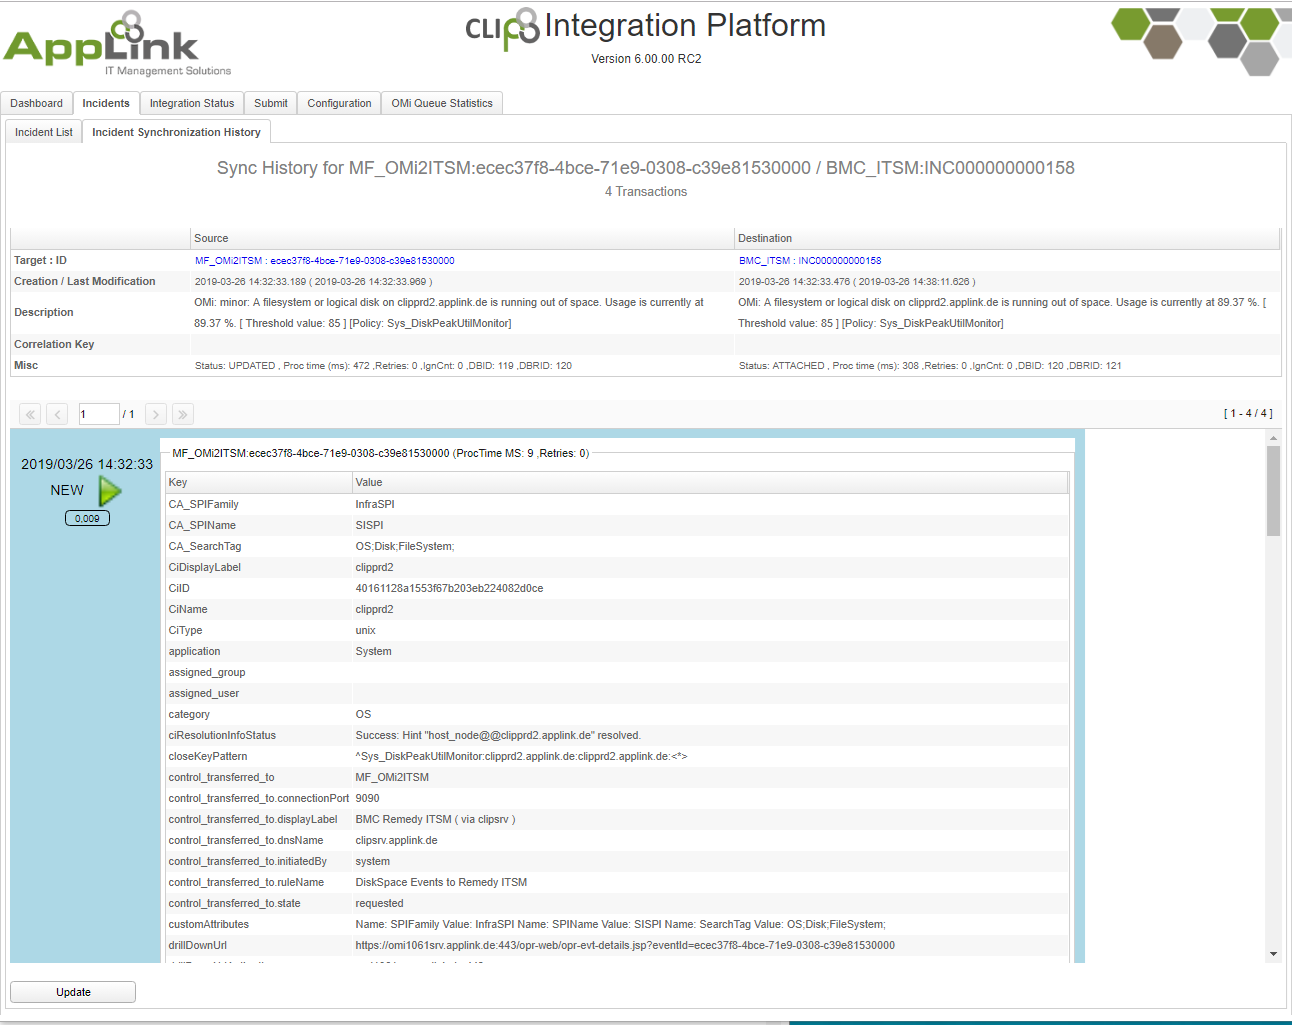
Clip receives events and incidents from its source targets and creates incidents in its peer targets. From then, both are kept in sync by receiving modifications and performing updates for the corresponding incidents. All transactions are stored in Clip's database and can be reviewed in the "Incidents Tab" in the Web UI.
The "Incidents Tab" displays two lists: the upper list displays events and incidents managed by Clip, and once an incident has been selected, Clip displays its peer incident(s) in the lower list.
The incidents list can be filtered by
- the target for which incidents should be displayed. The drop-down list can be used to select individual targets, or "All"
- ID: by entering an ID or part of it in the search field in the ID column, only events and incidents with matching IDs are displayed
- Description: by entering a description or part of it in the search field in the description column, only events and incidents with matching IDs are displayed
- status: please select the status to display events and incidents of status "active", "closed", "pending", "failed" or "all"

The incidents list can be sorted by clicking the header of one of the columns
- Date/Time Updated: ( default sort order, descending ) this column shows the timestamp of the last activity for an event or incident
- Date/Time Created: the timestamp when Clip has first received or created an event or incident
- Target: the name of the target
- ID: the unique identifier for an event or incident
- Create Time: the time in milliseconds for a create or update operation
- #R: number or retries. If Clip is not able to perform a creation or update, it will retry the same operation. This column displays the number of retries
- #T: number of transactions. This counter displays the number of transactions – one transaction is e.g. receipt of a new or changed event, creation or update of an event or incident
- #P: number of peers: the counter for the related events. For example, if one event creates an incident and nine following events are attached to the same incident, this counter for the incident would display ten related peers.

To refresh the incident list, the "Update" button can be pressed. For a selected event / incident pair, the transaction history can be displayed by pressing the "Details" button. The "Incident Synchronization History" Tab shows all transactions along with the key / value pairs.
Integration Status Tab
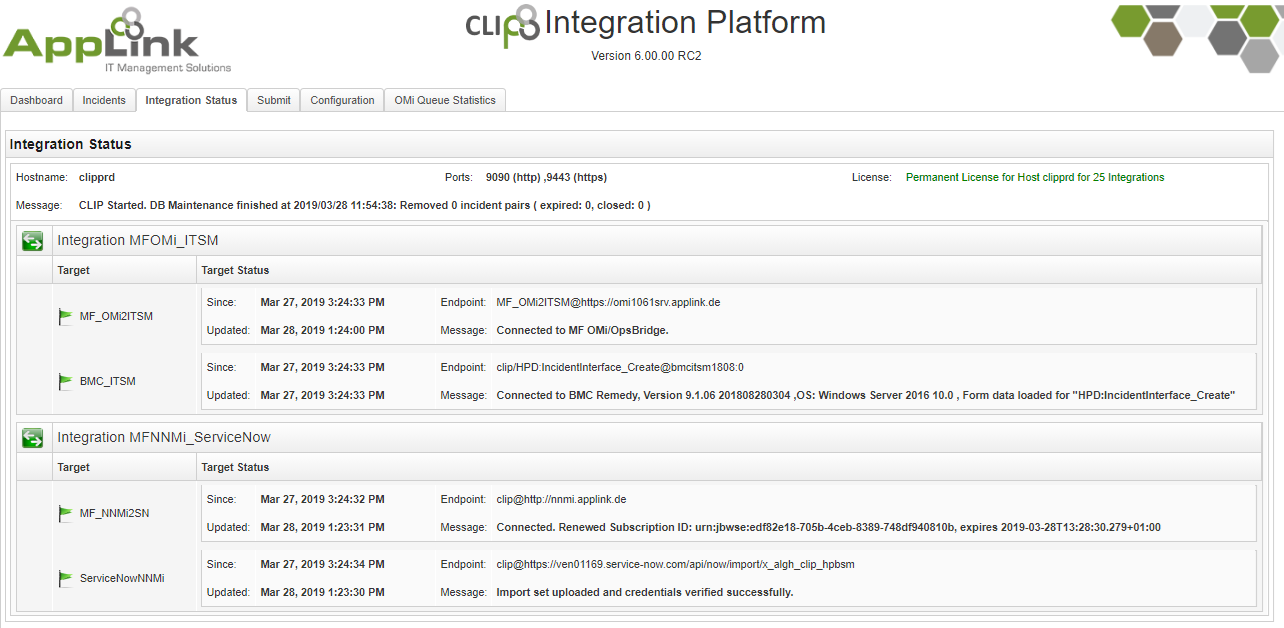
The "Integration Status" tab displays general information about the Clip instance, like
- the Clip hostname and the ports used
- license status and a
- Clip status message
In addition, for all integrations the status for the targets are shown - please note that the Status is updated in real time and does not need a refresh of the browser window.
Submit Tab
The "Submit" tab can be used to manually inject incidents and incident changes into the system for debugging and testing purposes:

Configuration Tab
The "Configuration" tab shows the configuration for Clip and allows to edit, validate, save and apply the settings.
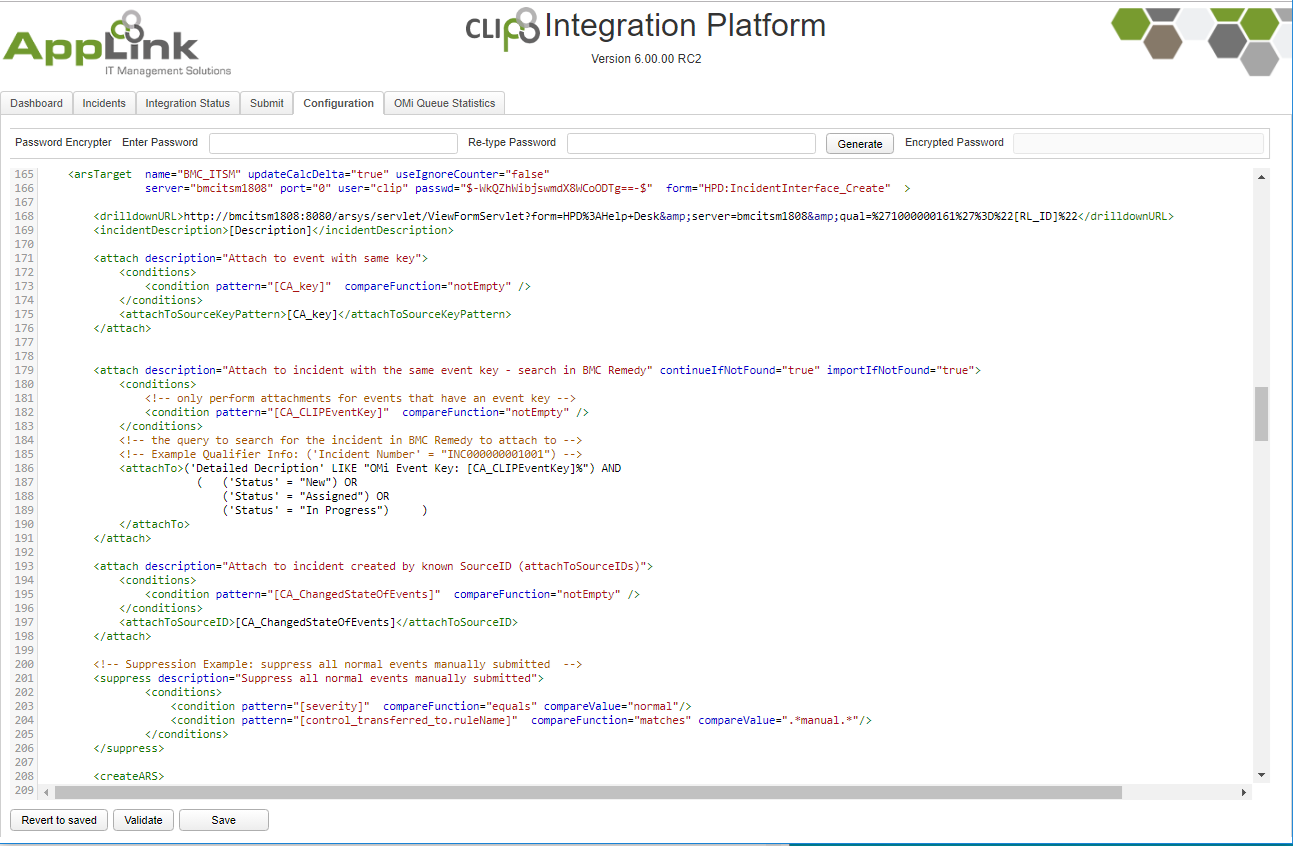
In the "Configuration" Tab, the file "[Clip]/conf/ClipConfig.xml" is edited. As an alternative, you can use your preferred editor instead ( e.g. notepad++ ), save and apply the modifued configuration by restarting the Clip service.